
Data
[Latest as of August 2025] Extended Data on China’s 30-m Annual Cropland Dataset for 1990–2023 (CACD-v1)
CACD 2022 and 2023 are now available!
The 30-m Annual Cropland Dataset of China (CACD) provides long-term, high-resolution maps of cropland extent across the country and has been widely applied in diverse studies. To meet the growing needs of the research community, we have extended the dataset to include the years 2022 and 2023, reprocessing all spatial tiles on the Google Earth Engine platform. In this updated version, minor methodological adjustments were introduced to further improve classification accuracy. For details on the mapping procedures and performance, please refer to the attached document.
- Download URL: https://zenodo.org/records/16927779
- Data format: GeoTIFF (.tif)
- Pixel size: 30 m (∼ 0.00027°)
- Projection: EPSG: 4326 (WGS84)
- Values: 1 denotes cropland and 0 denotes non-cropland
The 30 m annual cropland dataset of China from 1986 to 2021 (CACD)
The dataset was produced by using numerous Landsat satellite images on the cloud computing platform of Google Earth Engine. First, training samples were collected based on prerequisite knowledge, existing land cover baseline maps, and a time-weighted dynamic time warping method. Second, multi-year phenological features derived from time-series Landsat imagery were fed into a random forest classifier to obtain per-pixel annual cropland probabilities. Third, the LandTrendr change detection algorithm was employed to classify the cropland probability time series into several segments, in which breakpoints and corresponding years of changes were recorded. Fourth, annual cropland types were identified from the LandTrendr segmentation results based on the established discrimination rules. Finally, post-classification processing was applied to better refine cropland maps.
- Download URL: https://zenodo.org/records/7936885
- Data format: .tif
- Pixel size: 30 m
- Projection: EPSG-4326 (WGS84)
- Values: 1 denotes cropland and 0 denotes non-cropland
Interactive maps:
For more information on CACD, please refer to our accompanied paper: Ying Tu, Shengbiao Wu, Bin Chen, Qihao Weng, Peng Gong, Yuqi Bai, Jun Yang, Le Yu, and Bing Xu*. A 30 m annual cropland dataset of China from 1986 to 2021. Earth System Science Data. (2024): 2297-2316.
The 10-m crop type map of Ukraine in 2020
The map was generated using numerous publicly available satellite imagery and a semi-supervised learning approach.
- Download URL: https://zenodo.org/records/11065080
- Data format: .tif
- Pixel size: 10 m
- Projection: EPSG-4326 (WGS84)
- Classification system:
| Class | Value |
|---|---|
| Non-cropland | 0 |
| Wheat | 1 |
| Sunflower | 2 |
| Rapeseed | 3 |
| Other | 4 |
| Maize | 5 |
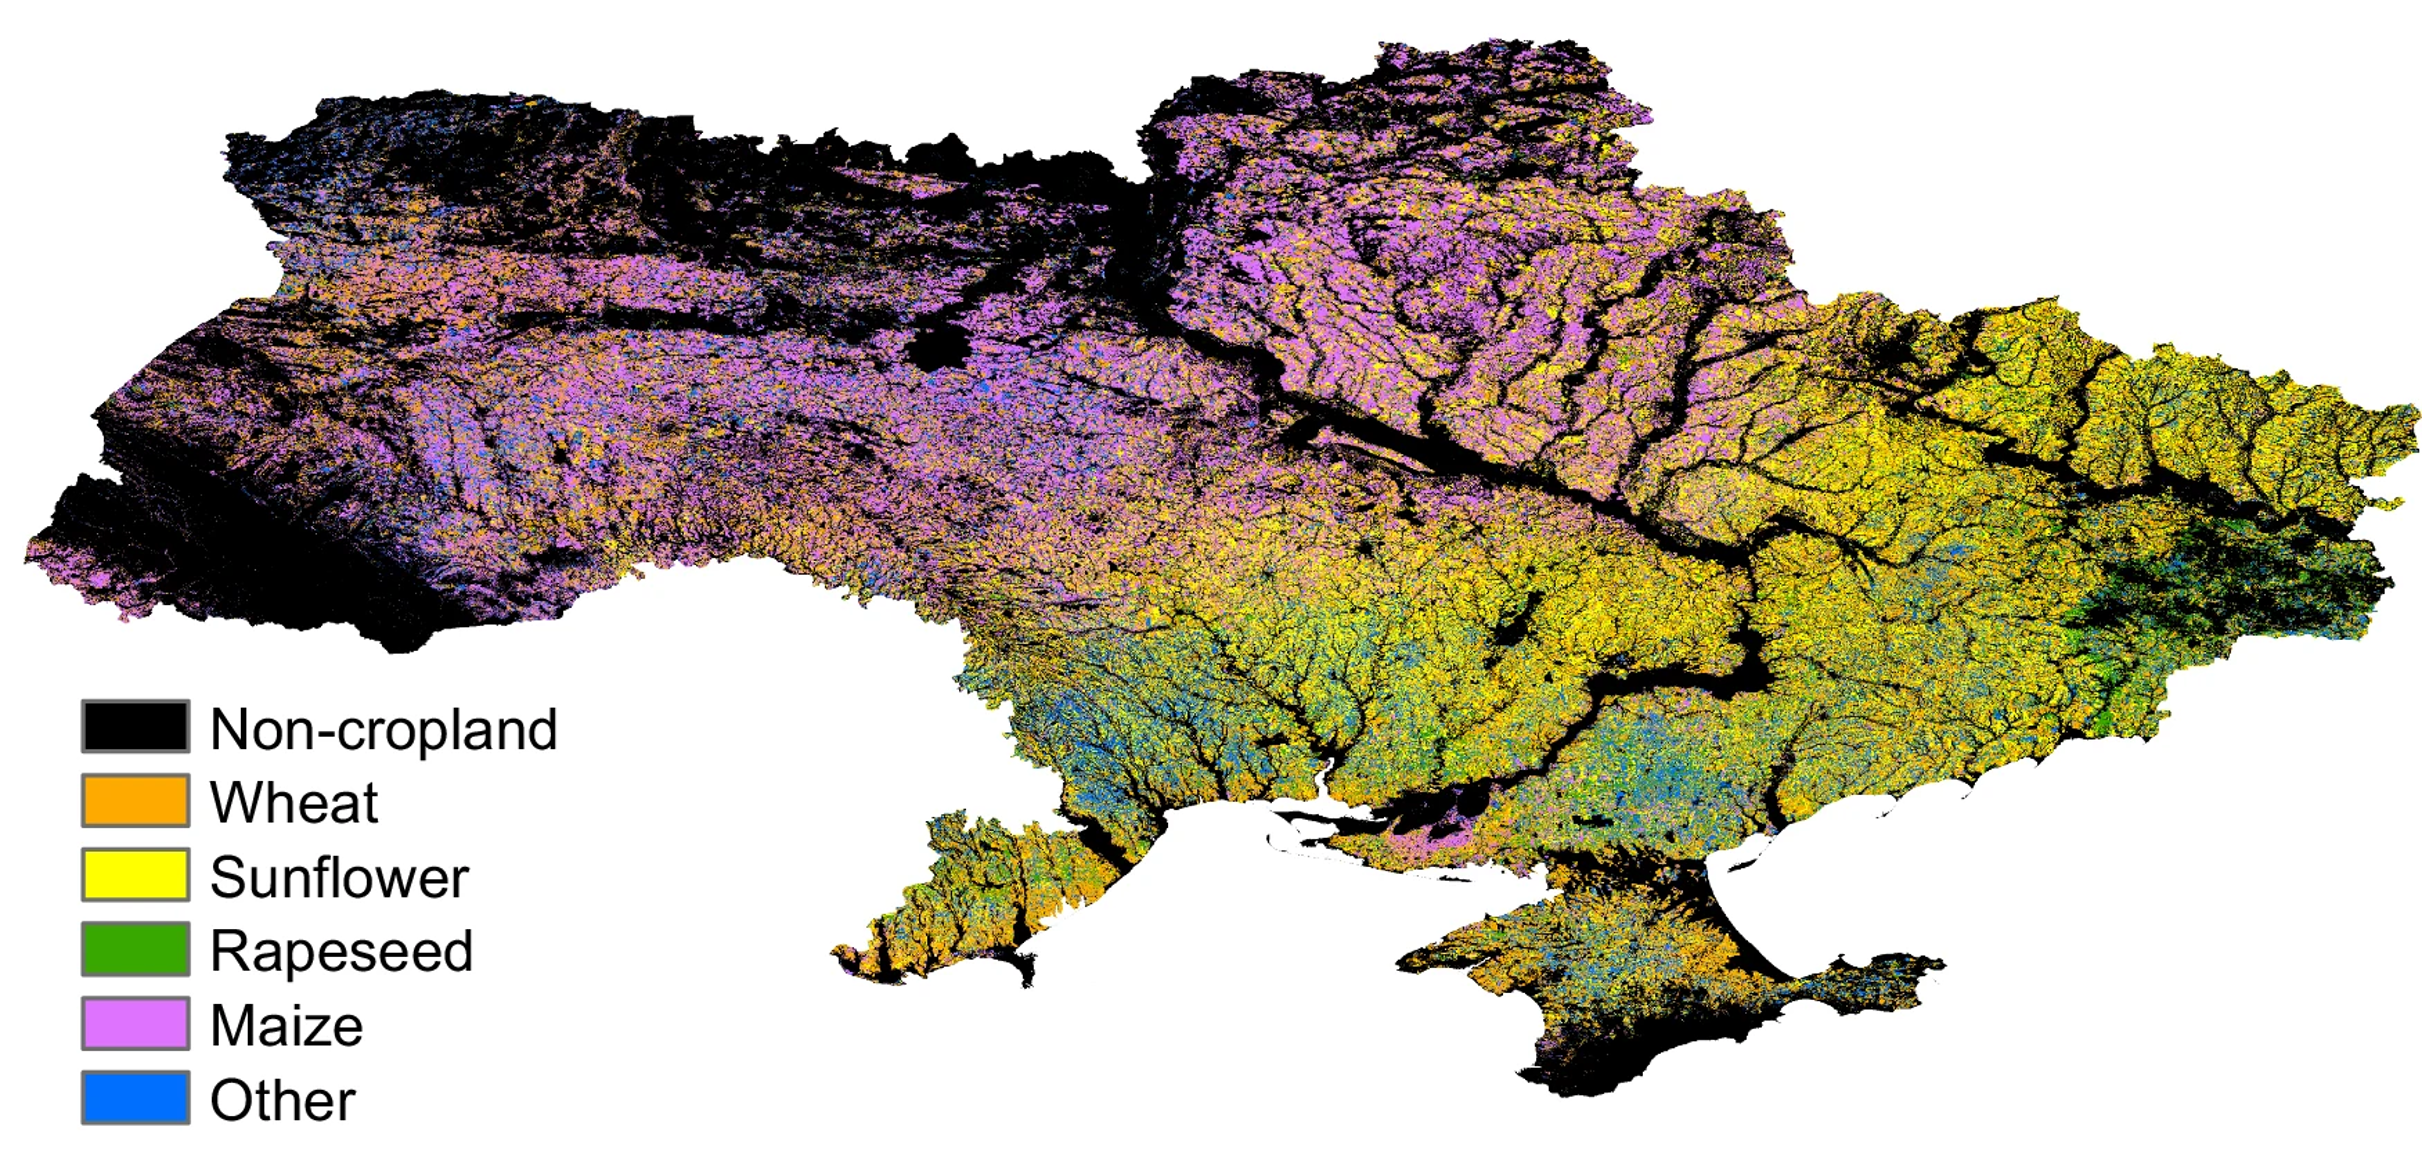
Reference: Bin Chen, Ying Tu, Jiafu An, Shengbiao Wu, Chen Lin, and Peng Gong. Quantification of losses in agriculture production in eastern Ukraine due to the Russia-Ukraine war. Communications Earth & Environment 5 (2024): 336.
The 10 m land cover dataset of Guangdong, China in 2019
Land cover information depicting the complex interactions between human activities and surface change is critically essential for nature conservation, social management, and sustainable development. Recent advances have shown great potentials of remote sensing data in generating high-resolution land cover maps, but it remains unclear how different models, data sources, and inclusive features affect the classification results, which hinders its applications in regional studies requiring more accurate land cover data. Informing these issues, here we developed a robust framework to improve the mapping results of 10 m resolution land cover classification in Guangdong Province, China using thousands of manually collected samples, multisource remote sensing data (Sentinel-1, Sentinel-2, and Luojia-1), machine learning algorithms, and a free cloud-based platform of Google Earth Engine. Results showed that an overall accuracy of 86.12% and a Kappa coefficient of 0.84 could be achieved for land cover classification in Guangdong for 2019. We found that random forest models achieved better performance than classification and regression trees, minimum distance, and support vector machine models. We also found that features derived from Sentinel-1 data and Sentinel-2 spectral indices greatly contributed to the classification process, while the feature of Luojia-1 data was not as much important as other configurations. A comparison between our results and several existing land cover products in terms of classification accuracy and visual interpretation further validated the effectiveness and robustness of the proposed framework. Our experiments and findings not only systematically elucidate the role of classification methods and data sources in deriving more accurate and reliable land cover maps but also provide certain guidelines for future land cover mapping from regional to global scales.
- Download URL: https://drive.google.com/drive/folders/1jMmM6VXK8yNpAQ0M4TZ0c3DSwxtGa46l?usp=sharing
- Data format: .tif
- Pixel size: 10 m
- Projection: EPSG-4326 (WGS84)
- Classification system:
| Class | Value |
|---|---|
| No-data | 0 |
| Cropland | 1 |
| Forest | 2 |
| Grassland | 3 |
| Shrubland | 4 |
| Wetland | 5 |
| Water | 6 |
| Impervious area | 7 |
| Bareland | 8 |
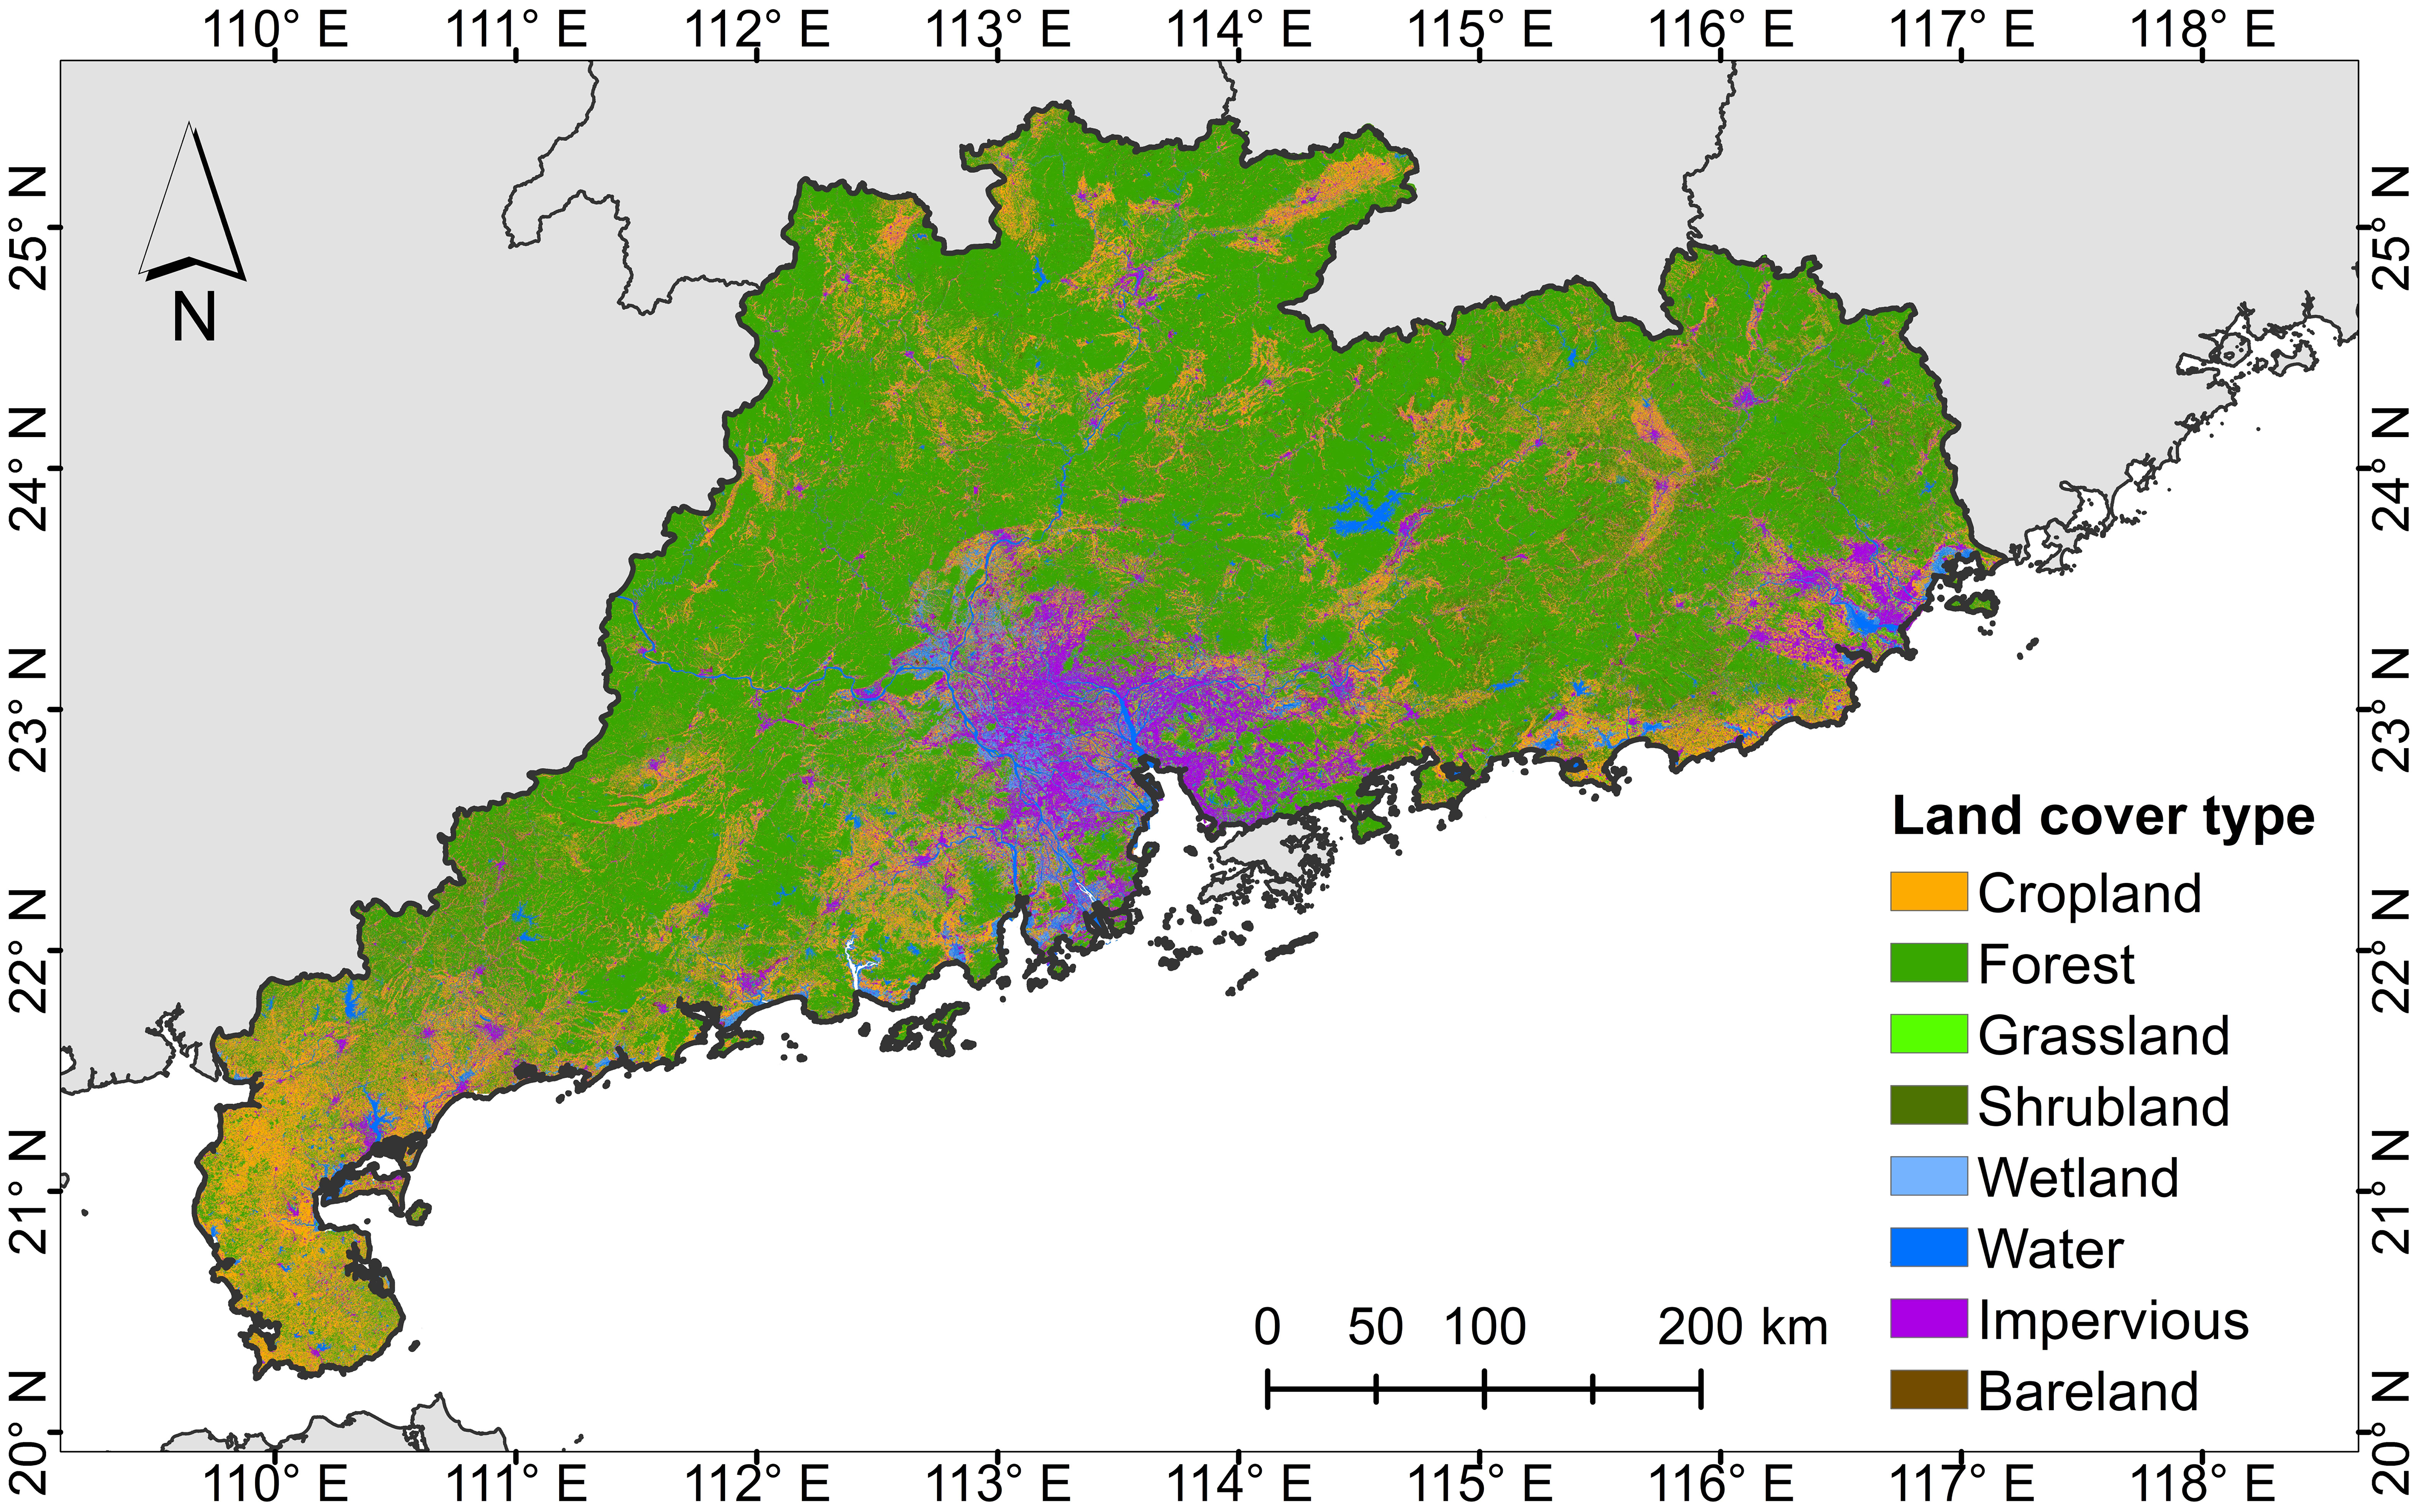
Reference: Ying Tu, Wei Lang, Le Yu, Ying Li, Junhao Jiang, Yawen Qin, Jiemin Wu, Tingting Chen, and Bing Xu*. Improved Mapping Results of 10 m Resolution Land Cover Classification in Guangdong, China Using Multisource Remote Sensing Data With Google Earth Engine. IEEE Journal of Selected Topics in Applied Earth Observations and Remote Sensing 13 (2020): 5384-5397.