Mapping Annual Cropland Dynamics in China
Accurate, detailed, and up-to-date information on cropland extent is crucial for provisioning food security and environmental sustainability. However, because of the complexity of agricultural landscapes and lack of sufficient training samples, it remains challenging to monitor cropland dynamics at high spatial and temporal resolutions across large geographical extents, especially for regions where agricultural land use is changing dramatically. Here we developed a cost-effective annual cropland mapping framework that integrated time-series Landsat satellite imagery, automated training sample generation, as well as machine learning and change detection techniques. We implemented the proposed scheme to a cloud computing platform of Google Earth Engine and generated a novel dataset of China’s annual cropland at a 30 m spatial resolution (namely CACD). Results demonstrated that our approach was capable of tracking dynamic cropland changes in different agricultural zones. The pixel-wise F1 scores for annual maps and change maps of CACD were 0.79 ± 0.02 and 0.81, respectively. Further cross-product comparisons, including accuracy assessment, correlations with statistics, and spatial details, highlighted the precision and robustness of CACD compared with other datasets. According to our estimation, from 1986 to 2021, China’s total cropland area expanded by 30 300 km2 (1.79 %), which underwent an increase before 2002 but a general decline between 2002 and 2015, and a slight recovery afterward. Cropland expansion was concentrated in the northwest while the eastern, central, and southern regions experienced substantial cropland loss. In addition, we observed 419 342 km2 (17.57 %) of croplands that were abandoned at least once during the study period. The consistent, high-resolution data of CACD can support progress toward sustainable agricultural use and food production in various research applications. The full archive of CACD is freely available at https://doi.org/10.5281/zenodo.7936885.
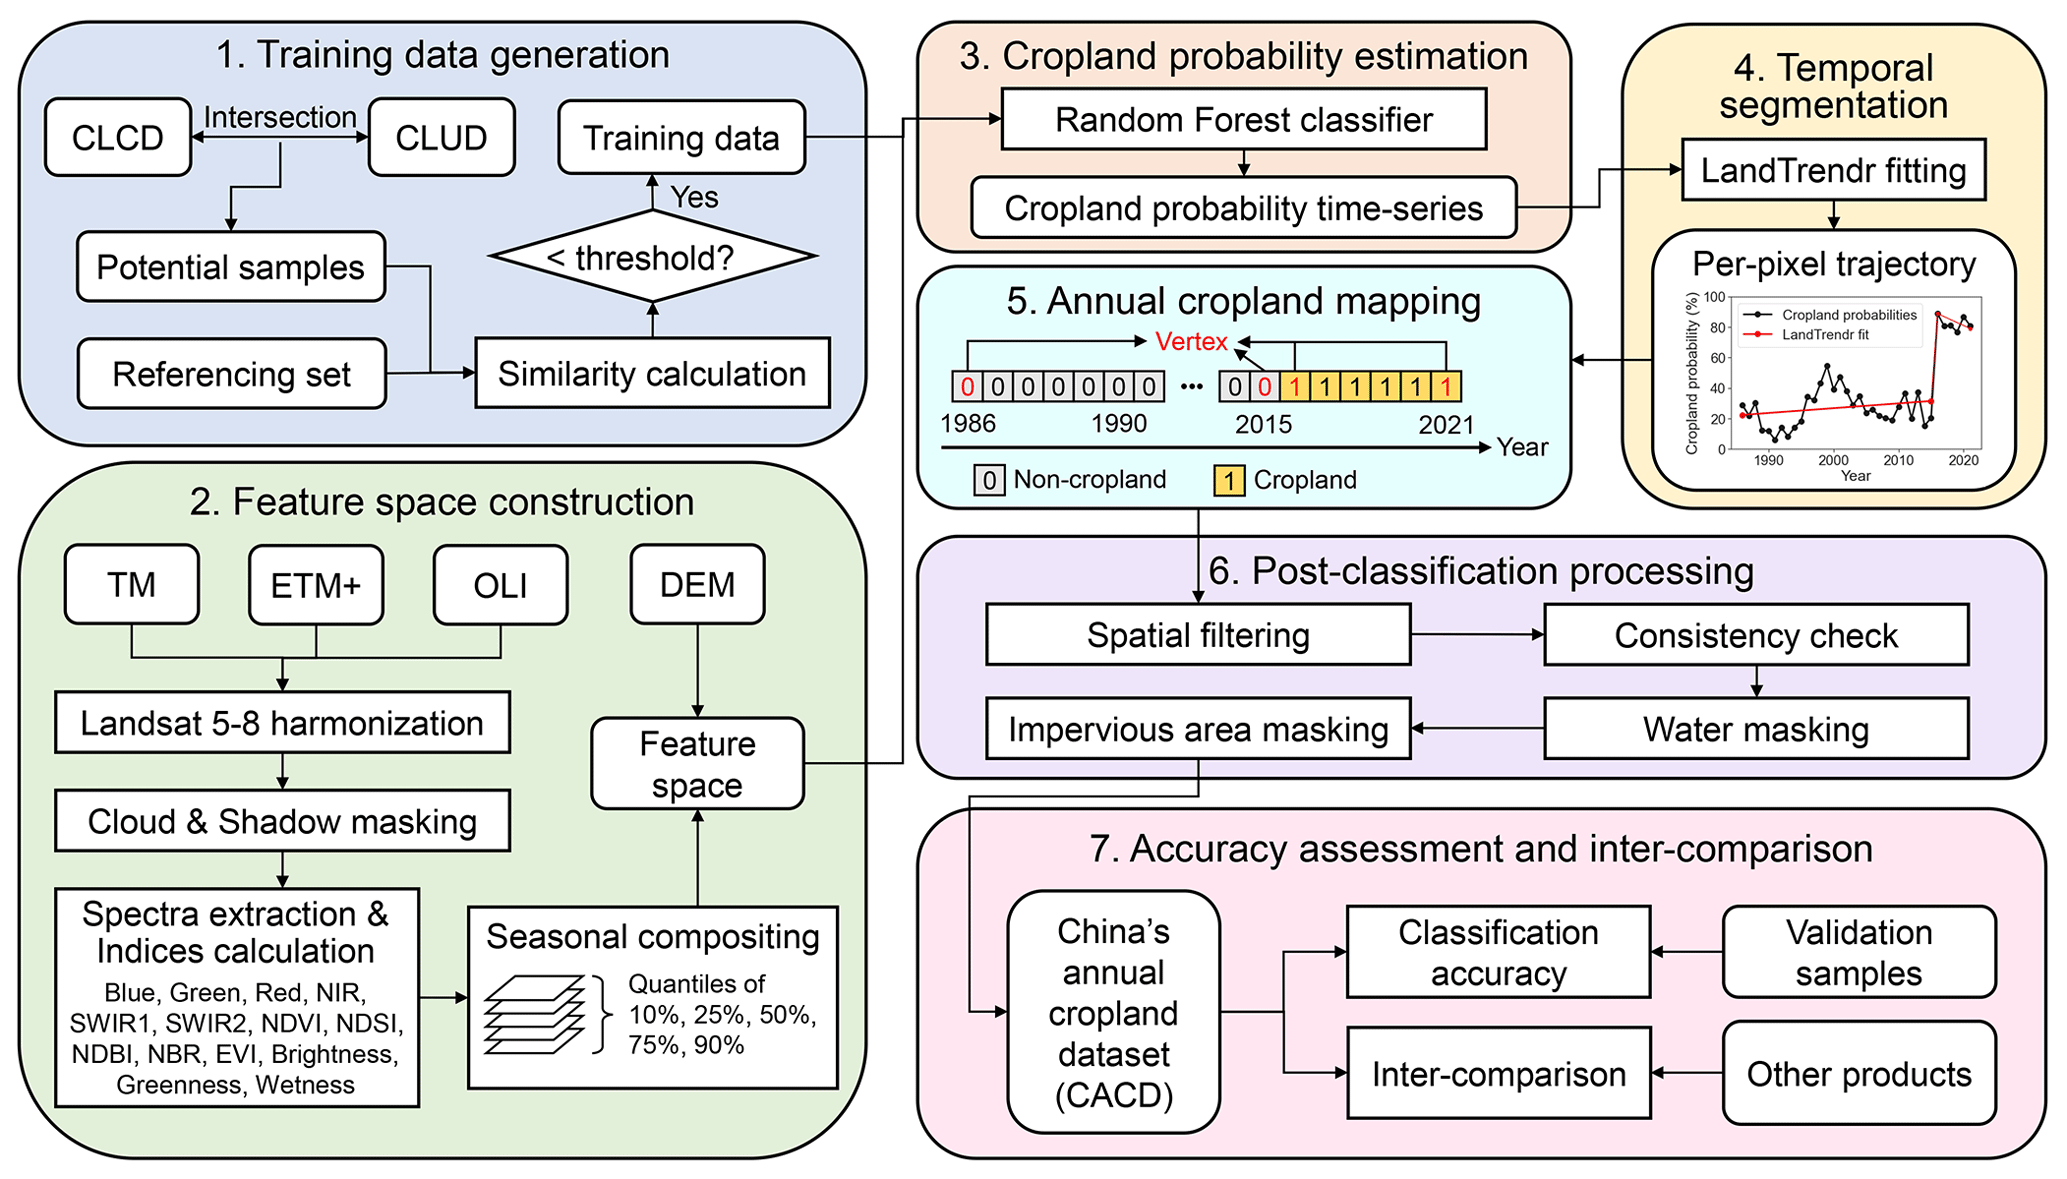
Flowchart of this study for mapping annual cropland dynamics.
We performed pixel-wise accuracy assessment of CACD based on the annual validation sample set. The F1 score, OA, UA, PA, and Kappa coefficient of annual maps on average were 0.79 ± 0.02, 0.93 ± 0.01, 0.79 ± 0.01, 0.79 ± 0.02, and 0.75 ± 0.02, respectively. Temporally, mapping accuracy after 2000 was generally higher than that before, probably due to the improvement in data quantity and quality of Landsat images in the later period. We also compared CACD with four existing land cover or cropland datasets (CLCD, CLUD, GLAD, and GFSAD) at 30 m spatial resolutions from multiple aspects. CACD was superior to other products in all comparison years in terms of mapping accuracy (Fig. 5). In 2015, for example, the F1 score of CACD was 0.85, followed by GFSAD (0.77), GLAD (0.76), CLCD (0.76), and CLUD (0.69). Spatially, the five products were consistent in delineating cropland distributions in major production areas including the Northeast Plain, North China Plain, Sichuan Basin, and Xinjiang. However, differences occurred in the Loess Plateau, Yunan–Guinan Plateau, and the vast hilly regions along the southeast coast. Overall, according to the frequency of how often pixels were identified as cropland, 65.62 % of the study area was labeled as croplands at least three times out of the five products (matched level > = 3).
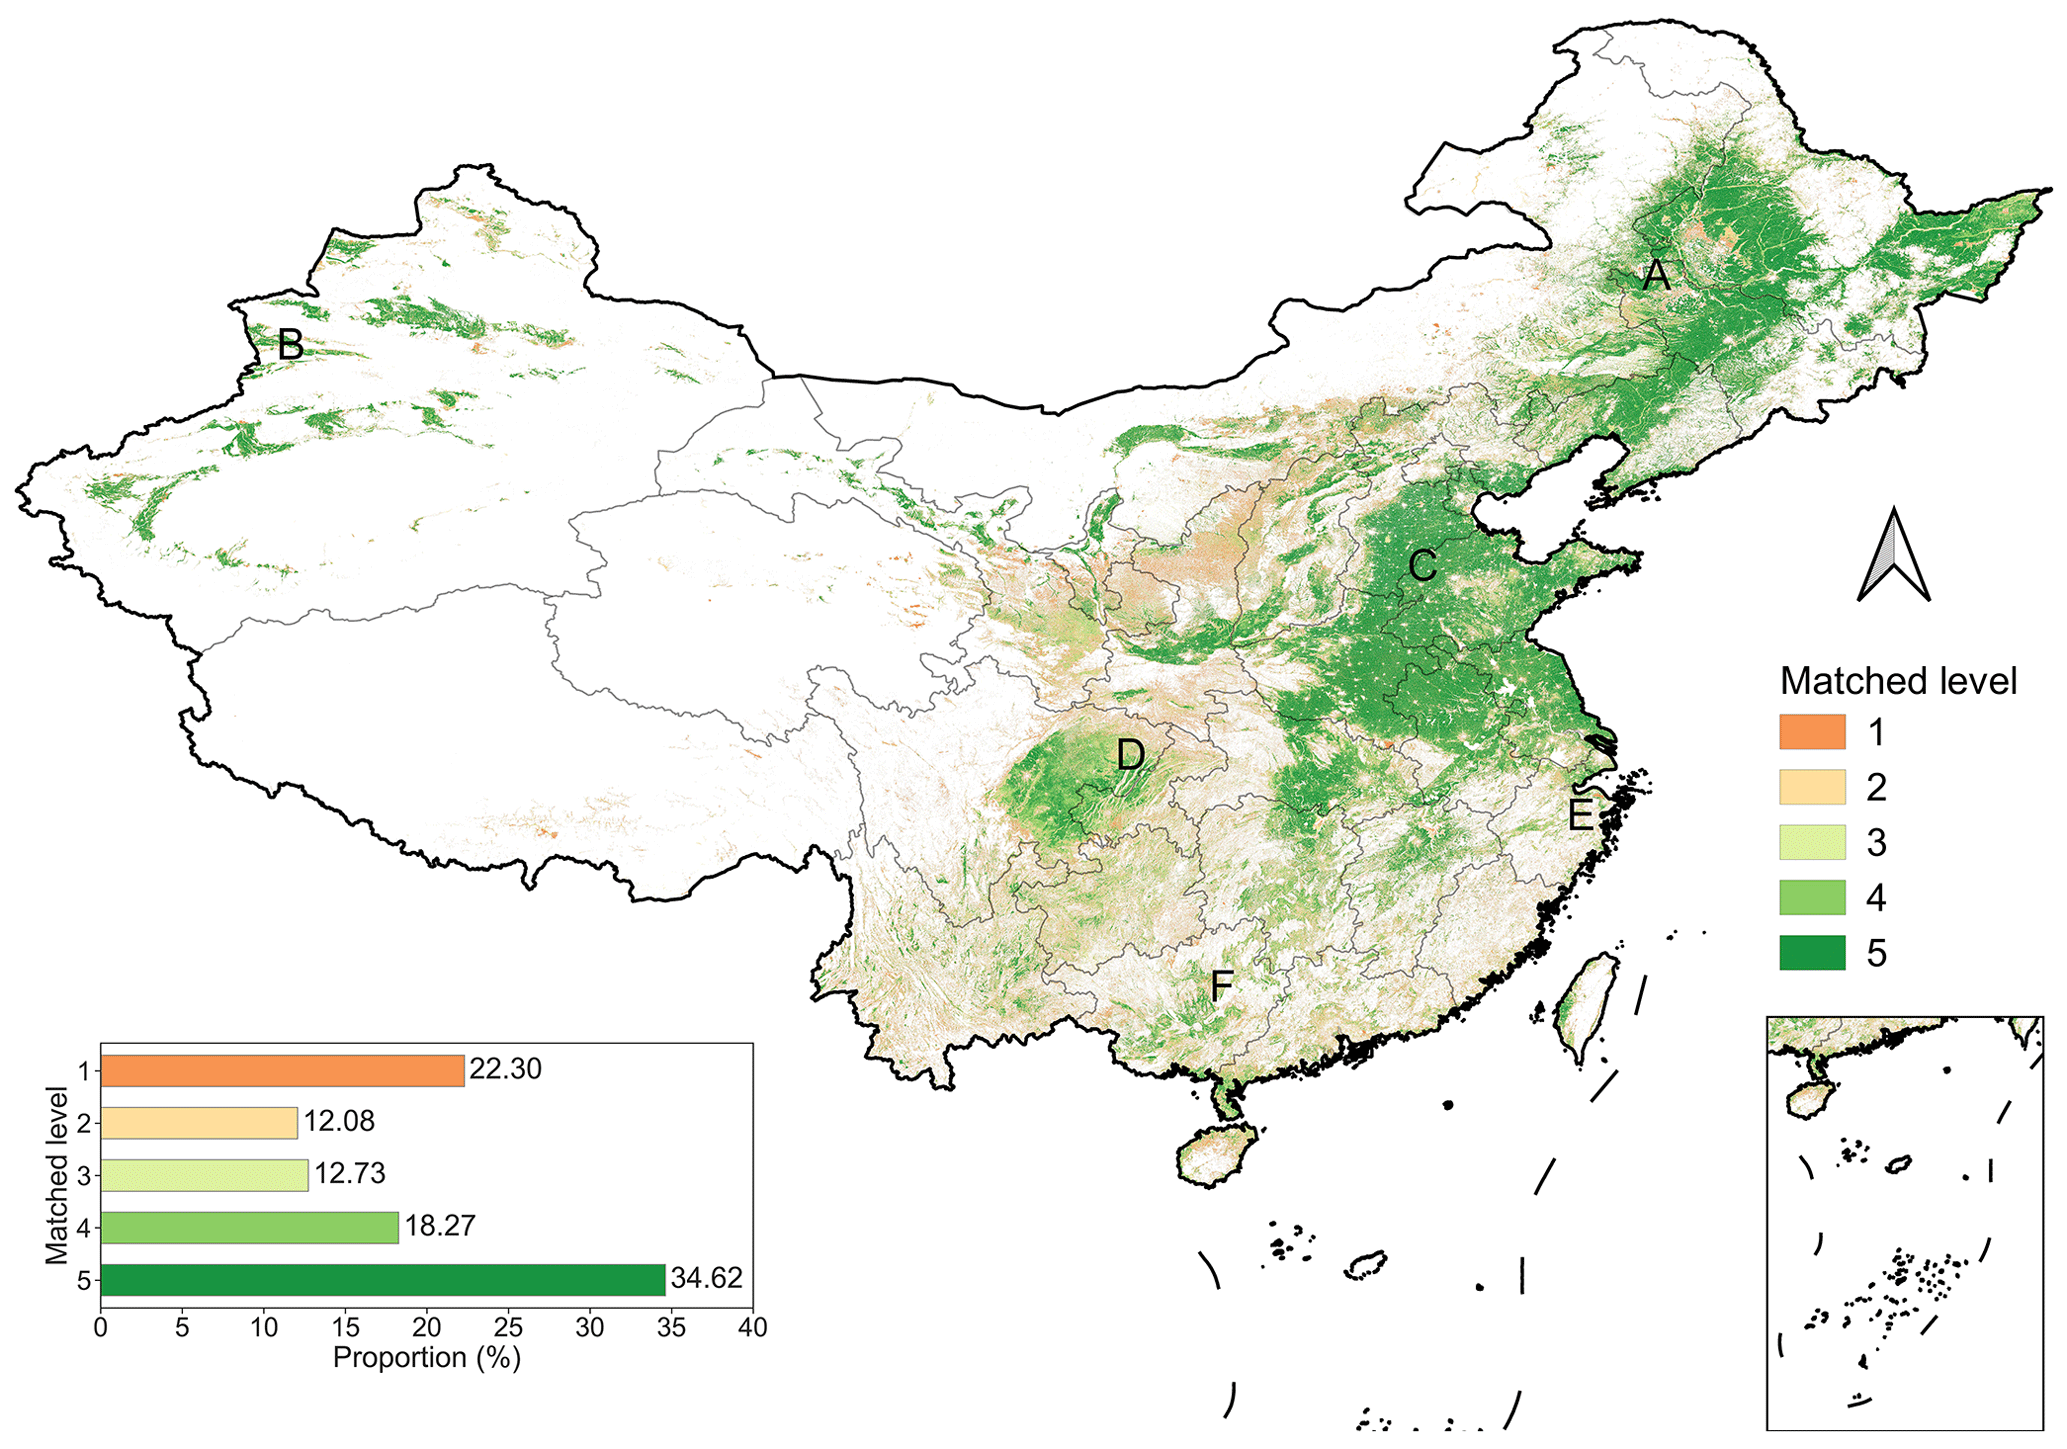
Spatial agreement of cropland extent of the five products (CACD, CLCD, CLUD, GLAD, and GFSAD) in 2015. Matched level indicates how often a pixel is identified as cropland. For example, “4” means four out of the five products recognize it as cropland. The bar chart in the lower-left corner denotes the area proportion of different matched levels (1–5).
In the Northeast Plain (region A), CACD, GLAD, and GFSAD depicted the extent of cropland well, while CLCD slightly overestimated and CLUD severely underestimated croplands. In Xinjiang and the North China Plain (regions B and C), high spatial consistency was observed between the five products, with CACD and GLAD displaying more details (like the road network). Classification differences mainly appeared in the southern hilly areas (regions D–F). In general, CACD, CLCD, and CLUD were more consistent and closer to the actual cropland distribution. For instance, region D was a terracing land in Sichuan Province, southwestern China. The region was mainly used for rice cultivation, yet those croplands were massively underestimated in GLAD and GFSAD.
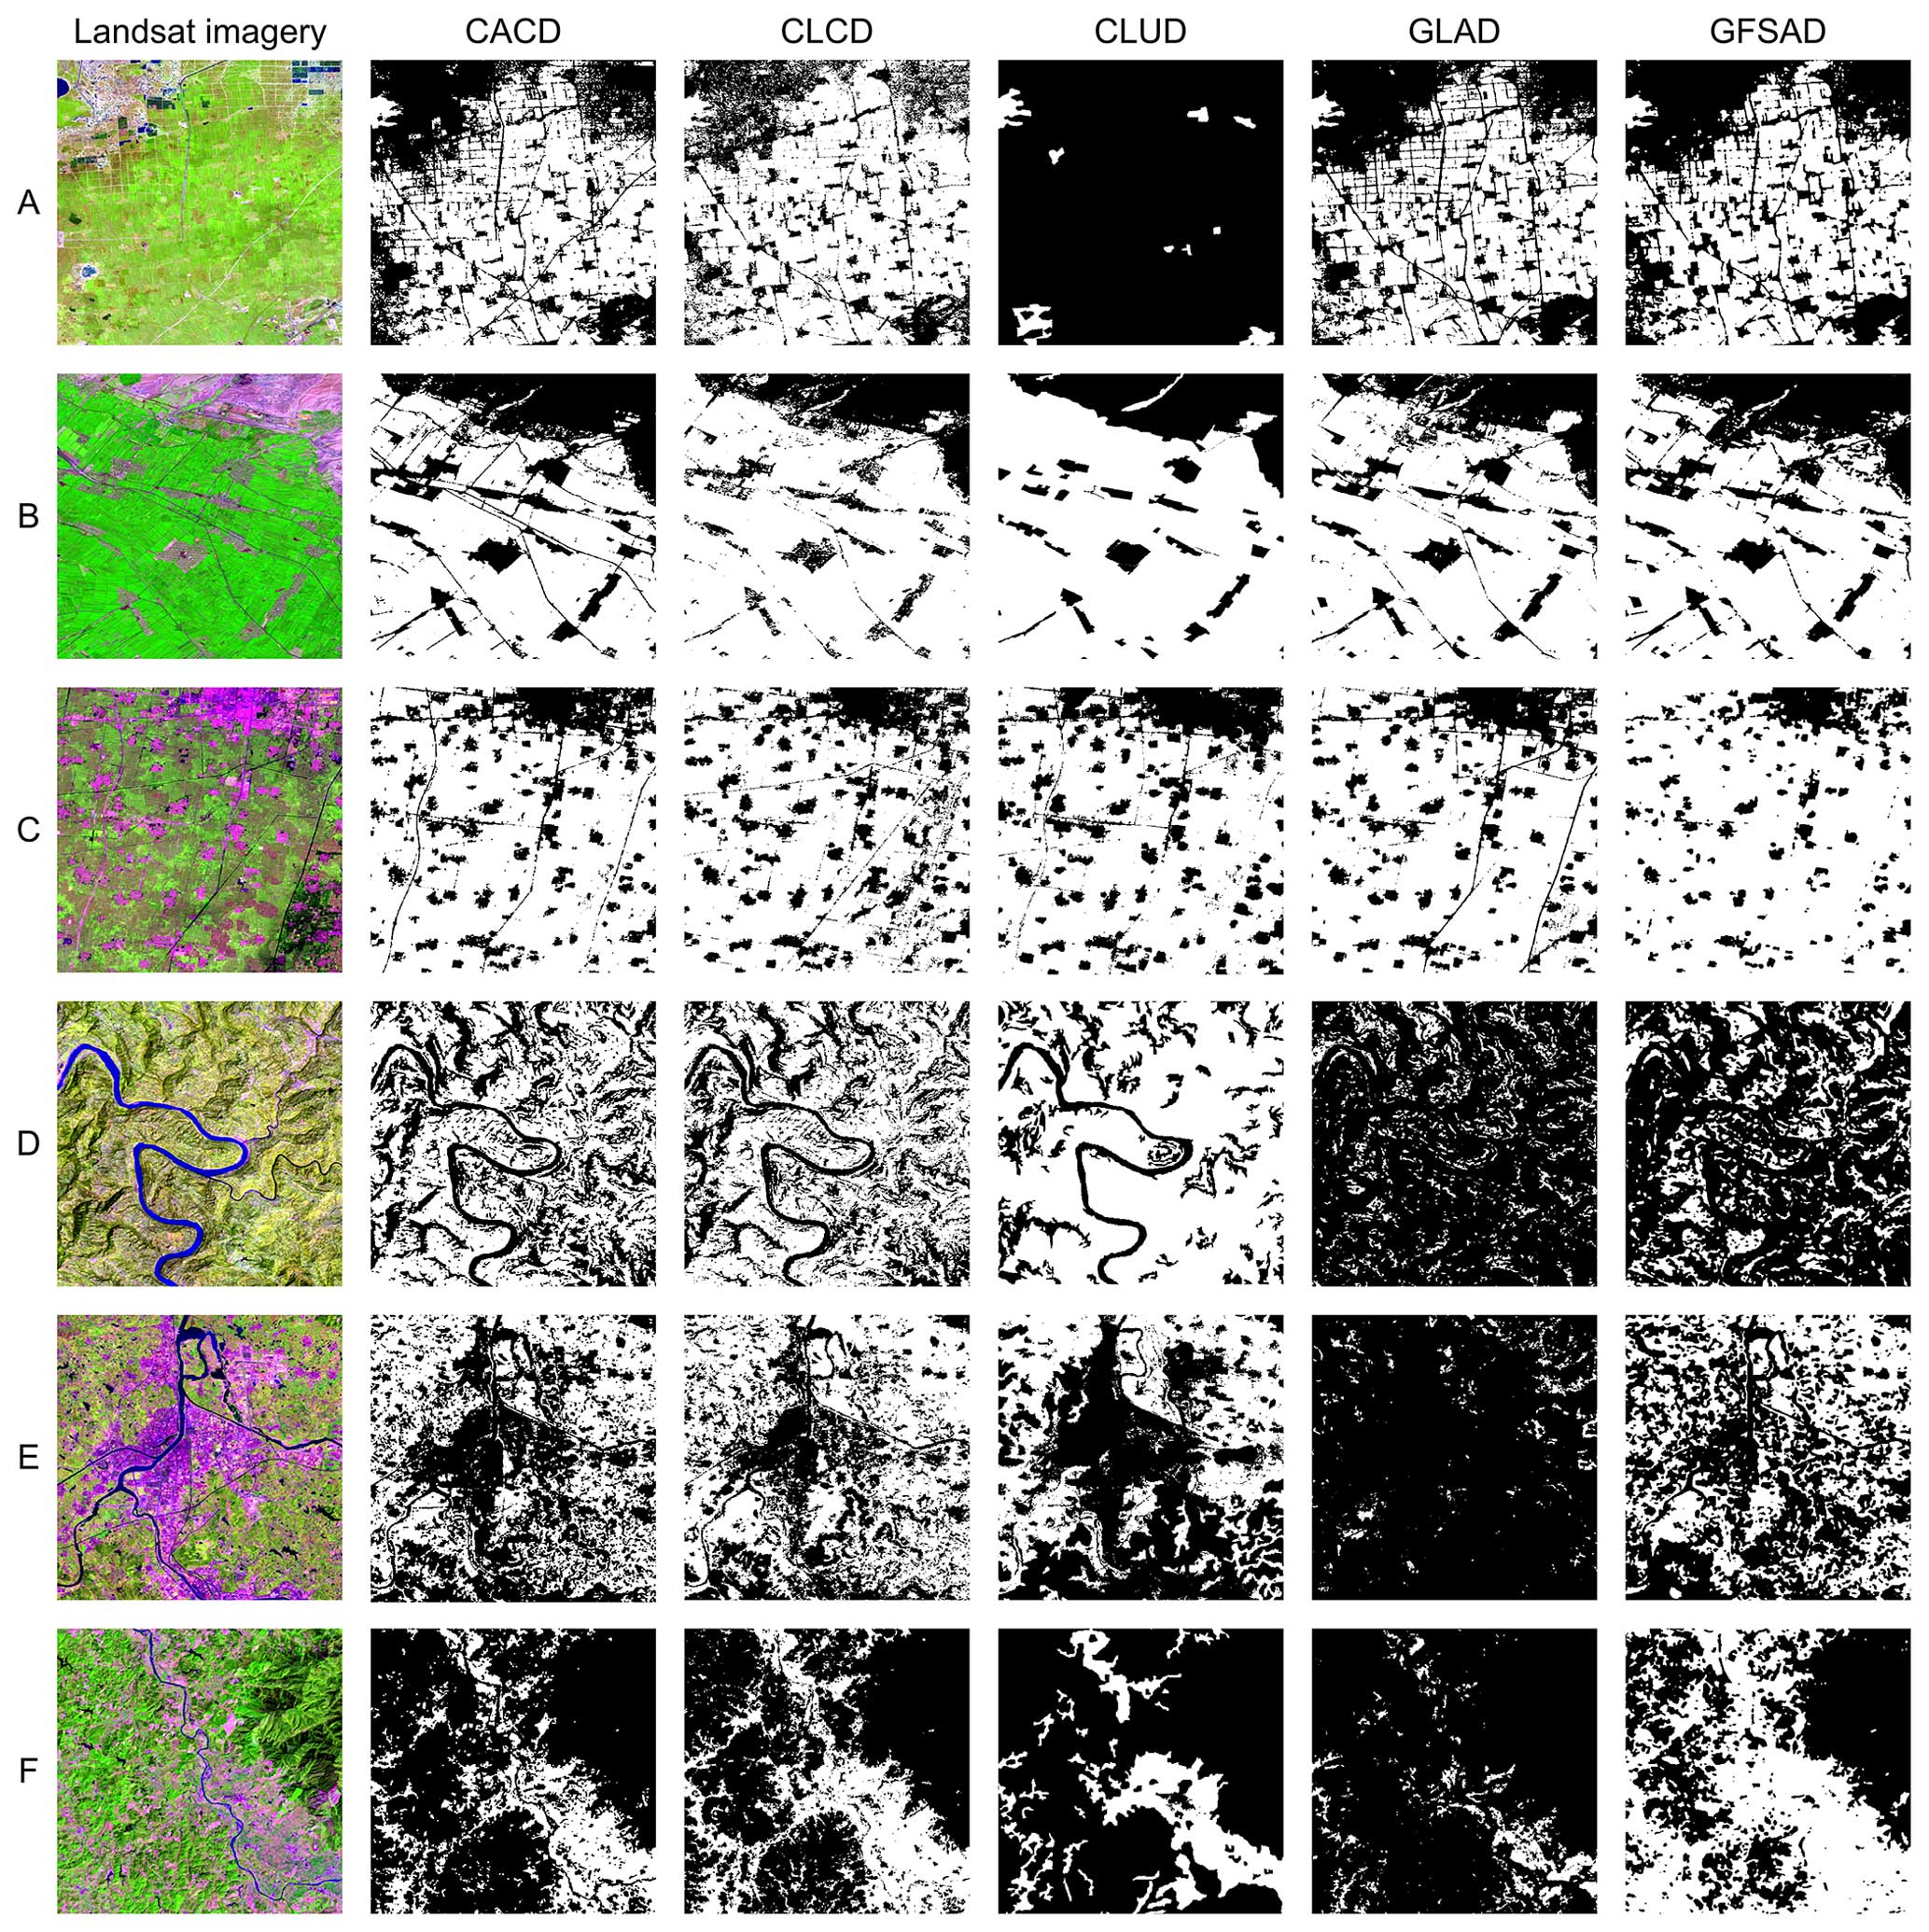
Regional comparisons of the five products in 2015. CACD outperforms other products in terms of classification accuracy and spatial details.
Based on the produced CACD, we calculated provincial net changes in cropland area between 1986 and 2021. Overall, China’s total cropland area grew from 1 694 900 ± 193 700 km2 in 1986 to 1 725 200 ± 212 400 km2 in 2021, a net increase of 30 300 km2 (1.79 %). Temporally, it underwent an escalation before 2002 but gradually declined until 2015, after which a recovery phase occurred (Fig. 9b). Spatially, cropland gain mainly occurred in northern and western China, including Xinjiang, Inner Mongolia, and Heilongjiang (Fig. 9a). In Xinjiang, for example, 44 635 km2 of the land area (∼ 3 %) has been developed as cropland during the past 36 years, a figure that is equivalent to 1.3 times the area of Hainan Province. In contrast, most provinces in eastern, central, and southern China have experienced massive cropland loss (Fig. 9a). The top five provinces with the largest area of cropland loss are Sichuan (12 739 km2), Jiangsu (10 865 km2), Shaanxi (10 700 km2), Hebei (8566 km2), and Shandong (8407 km2). In the capital city of Beijing, more than 2000 km2 croplands were occupied during the study period, accounting for 12 % of the city’s total area. Moreover, cropland areas in some inland provinces (such as Guizhou) were observed to remain relatively stable.
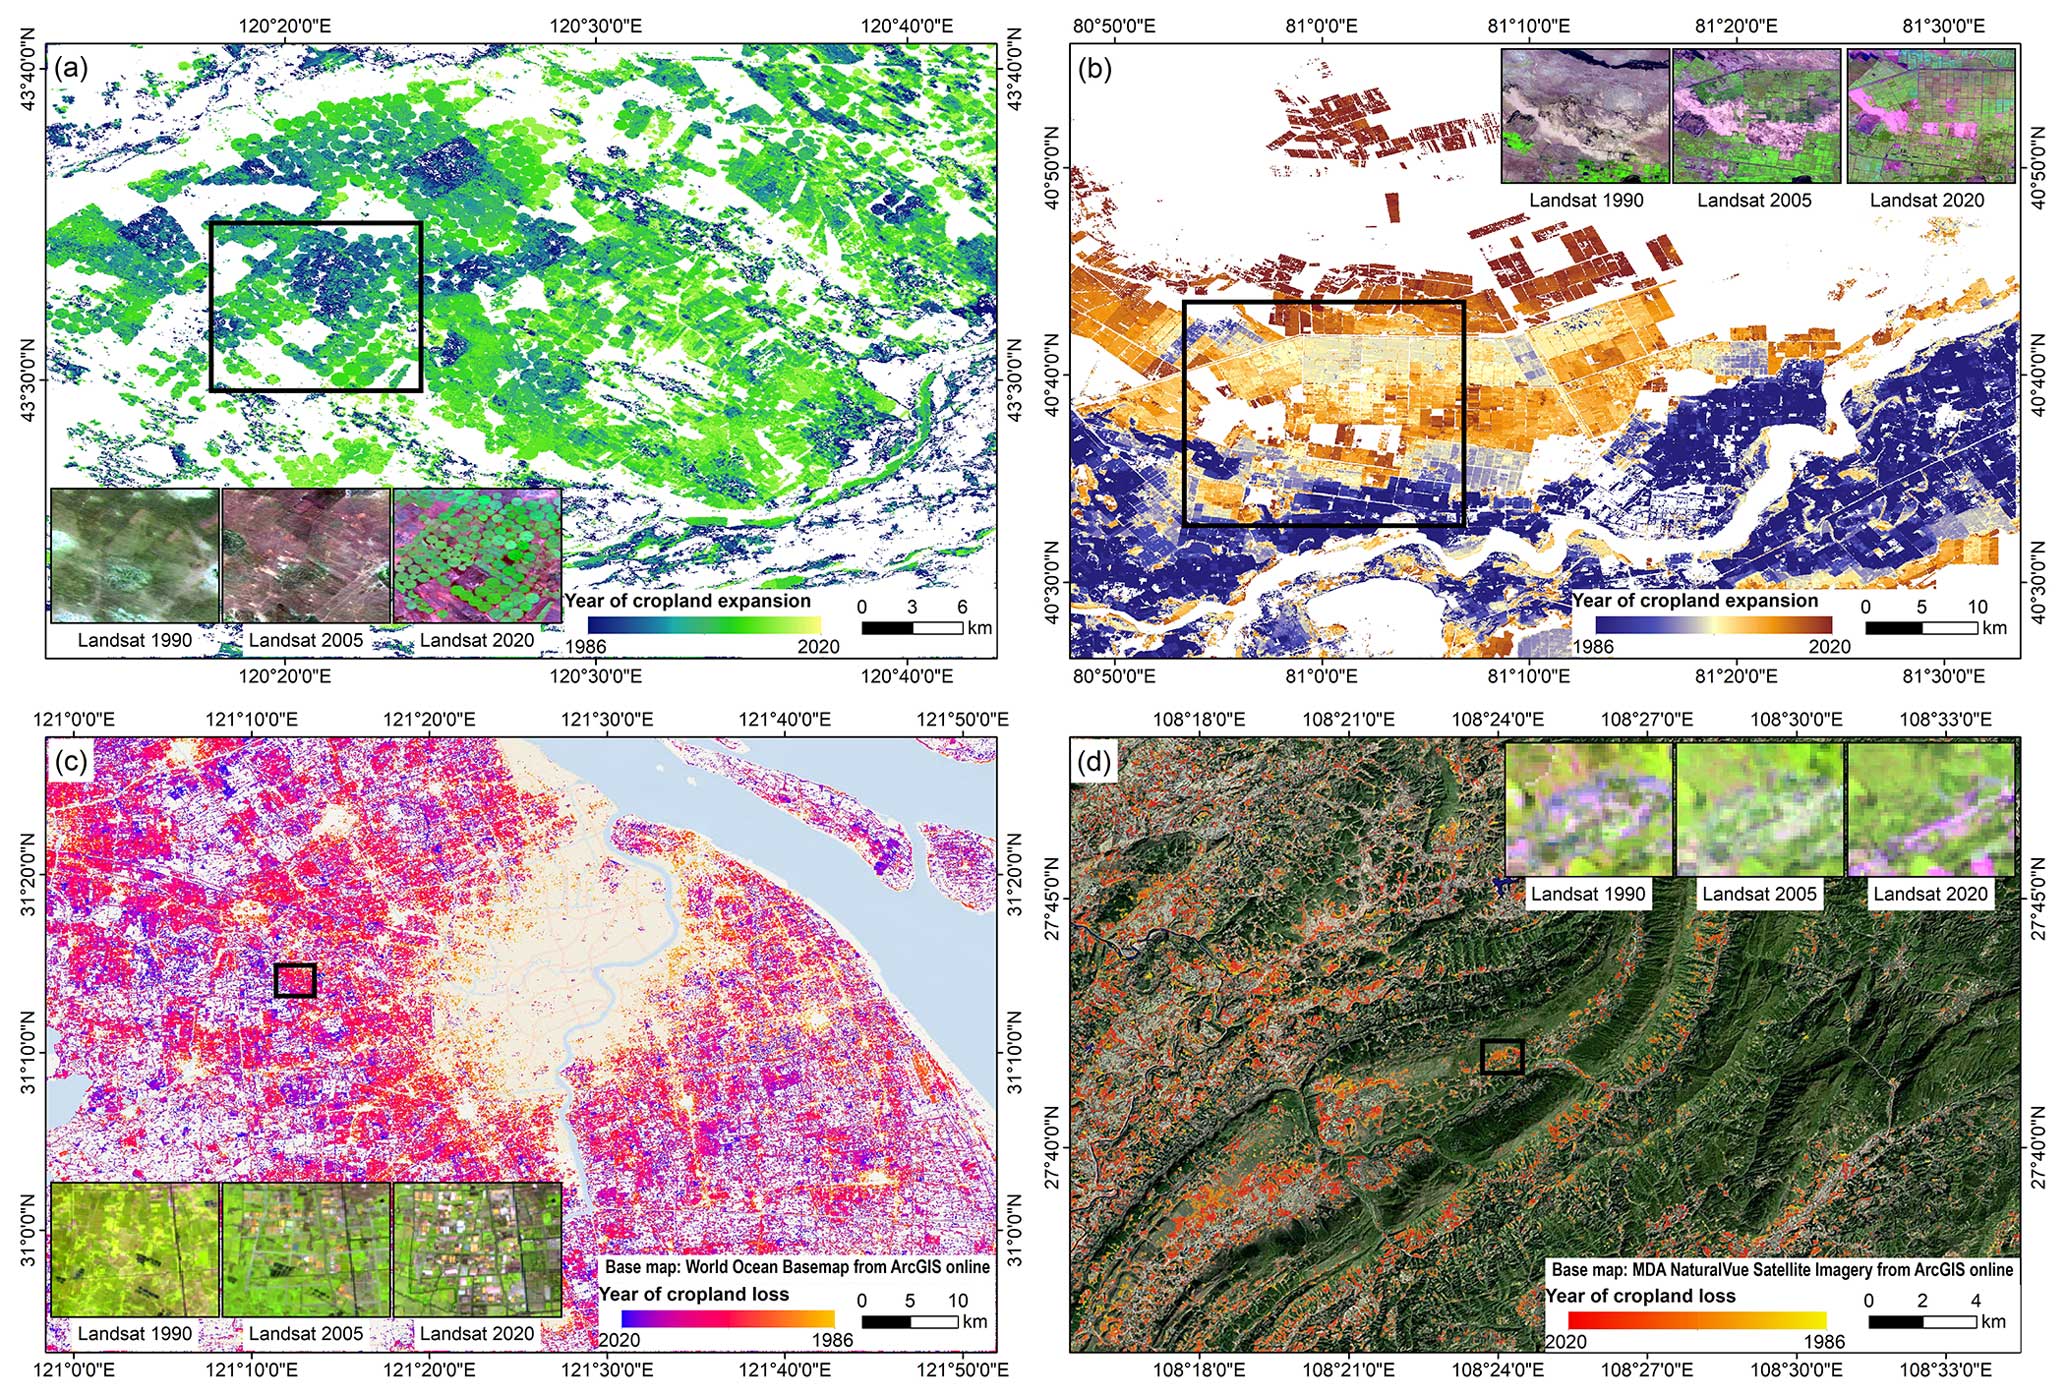
Examples of cropland expansion and loss between 1986 and 2021 in four selected regions in China: (a) Chifeng, Inner Mongolia, where large-scale cropland expansion occurred after 2006 for pasture cultivation; (b) Aksu, Xinjiang, which was mainly dominated by cotton cultivation; (c) Shanghai, where rapid urbanization induced extensive cropland loss; and (d) Tongren, Guizhou, where some croplands in the mountainous area had been abandoned due to soil infertile and rural out-migration.
Our results also revealed that 419342 km2 (17.57 %) of the croplands in China have been abandoned at least once during the past decades. Most abandoned croplands have been distributed in the central and the western regions (from 100 to 125° E and from 20 to 50° N), particularly in Inner Mongolia, Gansu, Shaanxi, and Yunan provinces. This spatial pattern is consistent with that of Li et al. (2018), who estimated the extent of cropland abandonment in China’s mountainous regions using multiple regression models. The average altitude of abandoned cropland is 860 m, 81 % of which is in regions below 1500 m. Temporally, the annual cropland abandonment area in China showed an upward trend from 1990 to 2015, i.e., it increased from 7516 to 14823 km2.
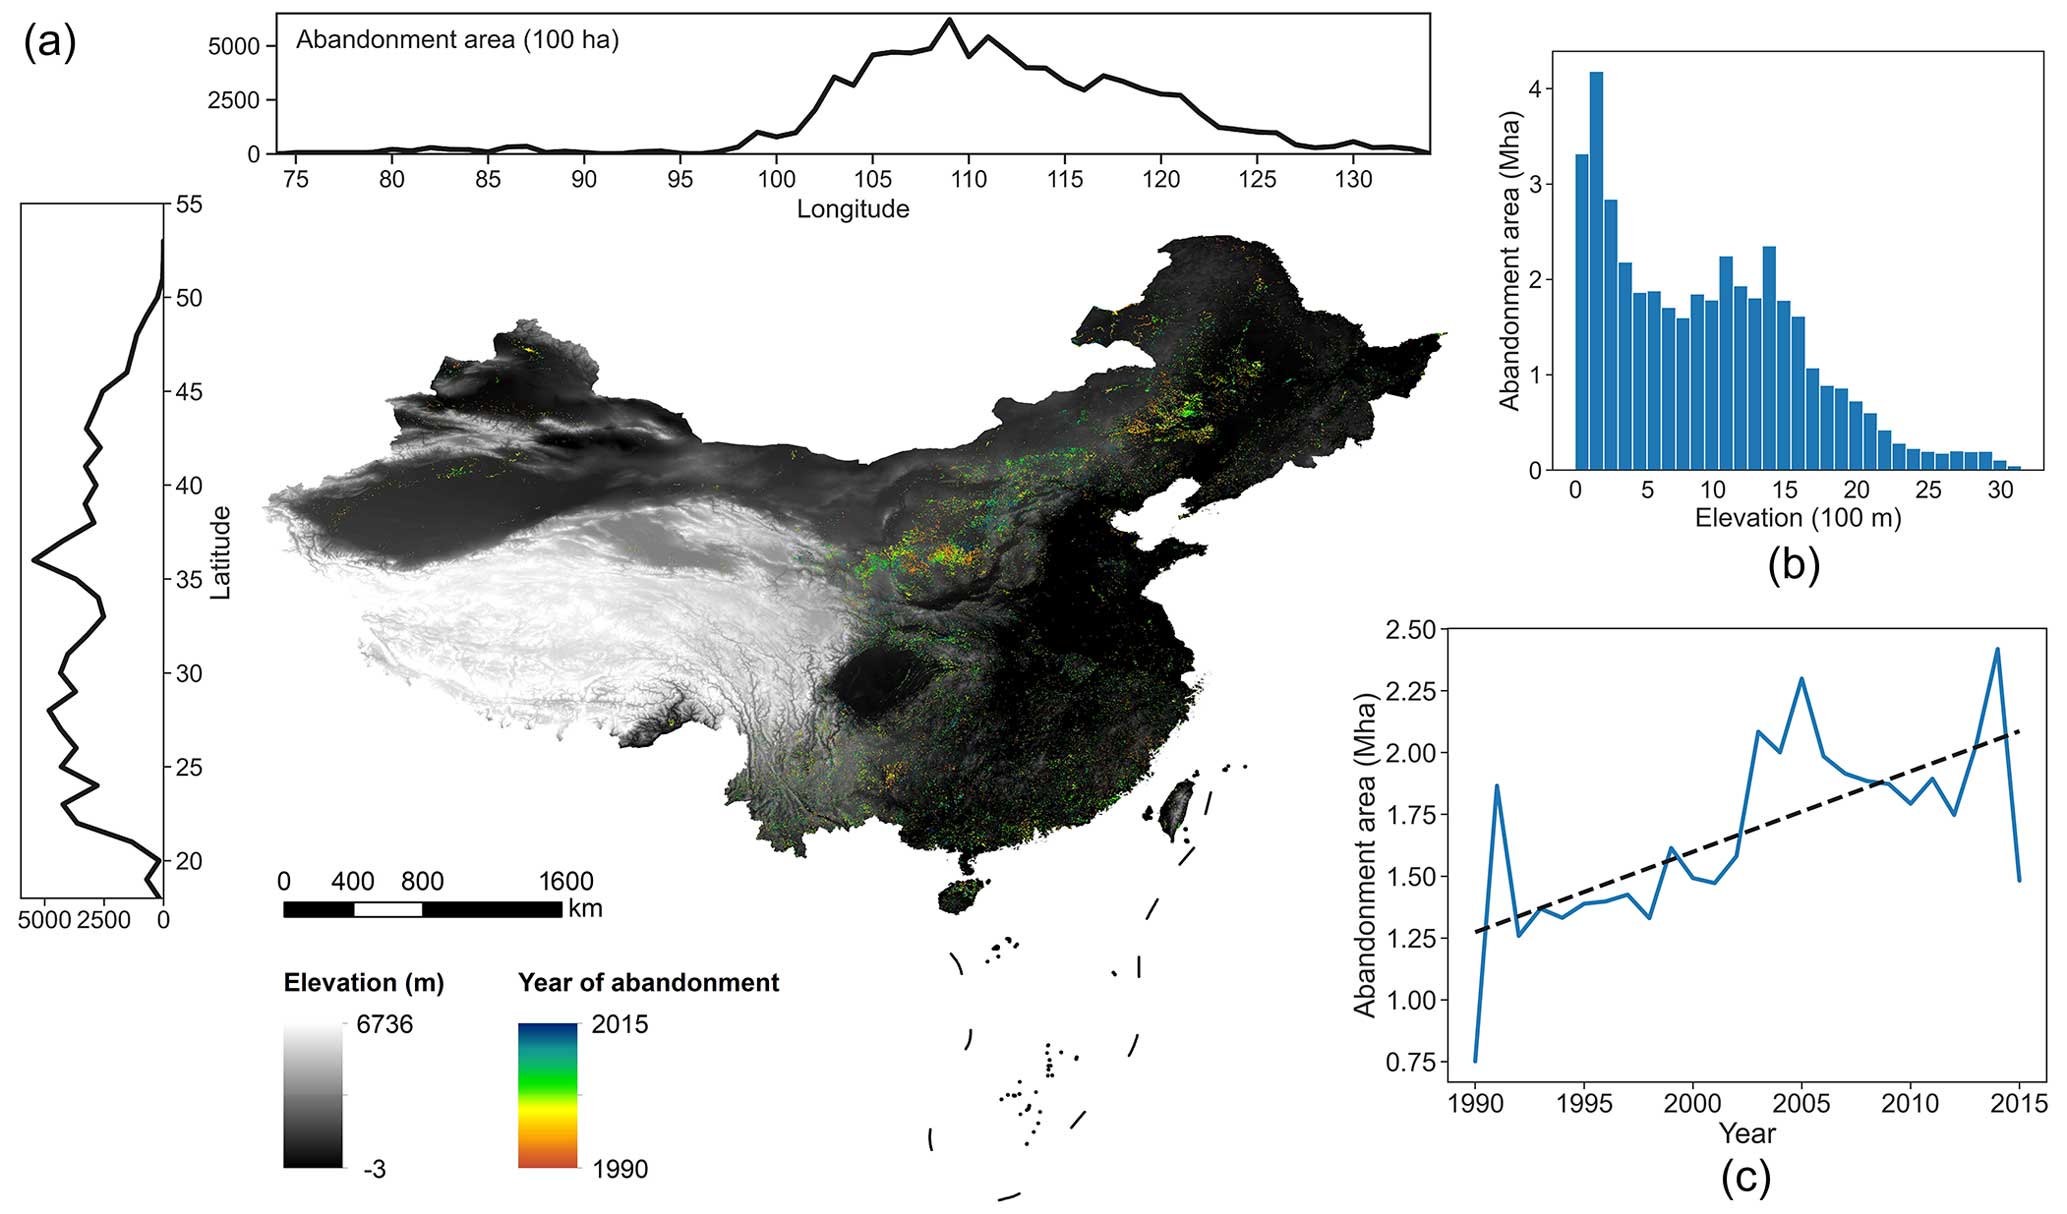
Cropland abandonment in China between 1990 and 2015. (a) Spatial distribution of abandonment time. (b) Histogram distribution within different elevation ranges. (c) Annual trends of abandonment area.
Reference: Ying Tu, Shengbiao Wu, Bin Chen, Qihao Weng, Yuqi Bai, Jun Yang, Le Yu, and Bing Xu*. A 30 m annual cropland dataset of China from 1986 to 2021. Earth System Science Data. (2024): 2297-2316.